I performed two trades on the FDAX and the mini DOW JONES
Normally I keep in WORD a diary after a trading day but I am looking for a software program to do this. Until now I didnot find a good program.
I finished a posting on Hellodax, about market participators, will be posted tomorrow.
Talking about diarries: this story about One Bad Trade performed is interesting stuff to read for anybody.
Selasa, 30 Mei 2006
Jumat, 26 Mei 2006
THE MARKET NOW
I was thinking the last couple of days about the market and the doom scenario's some described, comparing this market with the fall of the late nineties after 1997, talking about inflation risks and FED's chairman Greenspan commenting about the market and inflation.
Off course the usual conspiracy theories always pop up.
Niederhoffer posting about the common errors made by forecasters, quite amusing to read.
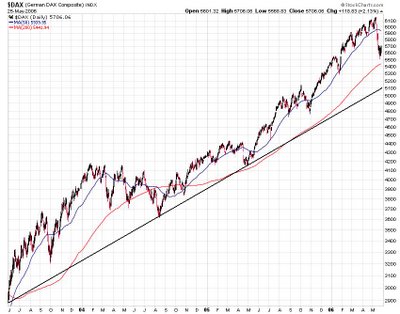
Markets started two weeks ago to go down rapidly, an end of a trend , off course I meant the trend of this year which started in November of last year; though the DAX still is in a big uptrend since 2003, see a classical uptrend in the chart below (click to enlarge).
Markets bounced up thursday, there were some clues though given by some. So Stephan Vita who posts this graph of the NYMO McClelan indicator, an indicator more often used by index followers, and asking the retorical question : "Why Does a Bounce Come?" ; it speaks for itself.
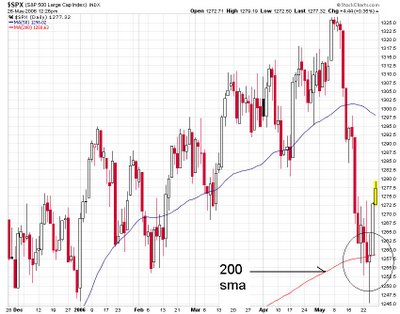
The S&P 500 bouncing off the 200 SMA very neatly: safed by the bell a least for the moment.
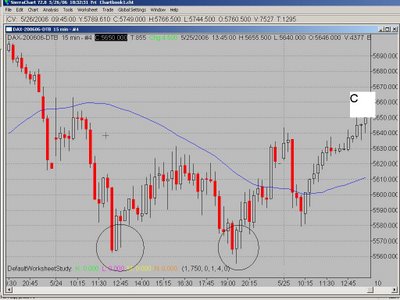
I am allways very cautious about predictions because who can predict the future? But to be honest I saw wednesday the FDAX nice bottoming out, with a double bottom and a positive divergence in price at C assuring at least a short term recovery.
Also read again Niederhoffer when he is Briefly Speaking about the markets and about romance too :)
FDAX
Dow Jones
Off course the usual conspiracy theories always pop up.
Niederhoffer posting about the common errors made by forecasters, quite amusing to read.
Markets started two weeks ago to go down rapidly, an end of a trend , off course I meant the trend of this year which started in November of last year; though the DAX still is in a big uptrend since 2003, see a classical uptrend in the chart below (click to enlarge).

Markets bounced up thursday, there were some clues though given by some. So Stephan Vita who posts this graph of the NYMO McClelan indicator, an indicator more often used by index followers, and asking the retorical question : "Why Does a Bounce Come?" ; it speaks for itself.
The S&P 500 bouncing off the 200 SMA very neatly: safed by the bell a least for the moment.

I am allways very cautious about predictions because who can predict the future? But to be honest I saw wednesday the FDAX nice bottoming out, with a double bottom and a positive divergence in price at C assuring at least a short term recovery.

Also read again Niederhoffer when he is Briefly Speaking about the markets and about romance too :)
FDAX
Dow Jones
Rabu, 24 Mei 2006
EXPECTANCY AND WINRATIO (3)
One of the results of my last posting on expectancy is the size of average win compared to the average loss:
"With these examples we see that increasing the average win is more favourable for the expectancy and therefore the profability than decreasing the average loss, but also that increasing the win ratio proportional increasing the expectancy."
There is a restriction to these statements: this is only true for a winratio p < 1/2. I stated it here due to my own bias towards trading in the sense that I never look at tradingsystems with a winratio smaller than 1/2.
Although completely possible for someone to trade, it is not my cup of tea. You may find and trade a sytem which produces 3 winners out of ten, the winners to be bigger than the losers. See the graph for the expectancy in this case in my posting before. I personally discard these systems because of the following reasons.
I. The outlier problem.
One of the problems of data sampling and data processing is the uneven influence outliers have on the results. A big trade outcome may be not representative but just a coincidence. You have to watch for this trap. How many data do you need to obtain reliable results? Though allways important for valuating a trade system, for a system with the need of bigger winns (a trend following system) this becomes very urgent. You may be waiting for another winner which may never show up.
There is another practical problem: you may not miss the bigger trades , this is allways possible for many reasons, your final outcome of your system being very sensitive to pick these winners.
II. The psychology involved
It can be very hard to trade a system in which many losers occur in a row. You have to be very patient and disclipined to trade a system like that. Your account has to be big enough to take this easily, the risk of a gambler's ruin is allways at stake here.
III. Consistency
Time consistenccy is an important facor in my trading and may be treated on a next occasion. For the moment it is enough to note that consistency in trade systems with lower win ratio's only may be expected in longer lasting time frames, a result badly bearable for me.
IV.Formal reasons
There exists a rigorous and formal model for a maximum betting size based on the work of Dubins and Savage (1976) in their book with the inspiring title How to Gamble if you Must. One of their results was that in an unfair game, eg. a game where your win chances are less than 1/2 (a play in which the odds are against you) your maximum chances are only achieved when staking the maximum. This is called 'bold play' in these models.
Later work confirms these results, see eg. an overview of Schweinsburg : Improving on bold play when the gambler is restricted. For a superfair game, eg when p>1/2, it has been shown that a more realistic timid strategy of staking being optimal.
Now these models cannot directly transformed to trading systems because they are restricted to so called red and black models in which outcomes are either black or red (plus 1 or minus 1 and so on, the casino games) but may give some clues to sub-optimal strategies when using winratios > 1/2.
Related:
Systemtrading
Expectancy
"With these examples we see that increasing the average win is more favourable for the expectancy and therefore the profability than decreasing the average loss, but also that increasing the win ratio proportional increasing the expectancy."
There is a restriction to these statements: this is only true for a winratio p < 1/2. I stated it here due to my own bias towards trading in the sense that I never look at tradingsystems with a winratio smaller than 1/2.
Although completely possible for someone to trade, it is not my cup of tea. You may find and trade a sytem which produces 3 winners out of ten, the winners to be bigger than the losers. See the graph for the expectancy in this case in my posting before. I personally discard these systems because of the following reasons.
- The problem of outliers.
- Psychology involved
- Consistency
- Formal reasons
I. The outlier problem.
One of the problems of data sampling and data processing is the uneven influence outliers have on the results. A big trade outcome may be not representative but just a coincidence. You have to watch for this trap. How many data do you need to obtain reliable results? Though allways important for valuating a trade system, for a system with the need of bigger winns (a trend following system) this becomes very urgent. You may be waiting for another winner which may never show up.
There is another practical problem: you may not miss the bigger trades , this is allways possible for many reasons, your final outcome of your system being very sensitive to pick these winners.
II. The psychology involved
It can be very hard to trade a system in which many losers occur in a row. You have to be very patient and disclipined to trade a system like that. Your account has to be big enough to take this easily, the risk of a gambler's ruin is allways at stake here.
III. Consistency
Time consistenccy is an important facor in my trading and may be treated on a next occasion. For the moment it is enough to note that consistency in trade systems with lower win ratio's only may be expected in longer lasting time frames, a result badly bearable for me.
IV.Formal reasons
There exists a rigorous and formal model for a maximum betting size based on the work of Dubins and Savage (1976) in their book with the inspiring title How to Gamble if you Must. One of their results was that in an unfair game, eg. a game where your win chances are less than 1/2 (a play in which the odds are against you) your maximum chances are only achieved when staking the maximum. This is called 'bold play' in these models.
Later work confirms these results, see eg. an overview of Schweinsburg : Improving on bold play when the gambler is restricted. For a superfair game, eg when p>1/2, it has been shown that a more realistic timid strategy of staking being optimal.
Now these models cannot directly transformed to trading systems because they are restricted to so called red and black models in which outcomes are either black or red (plus 1 or minus 1 and so on, the casino games) but may give some clues to sub-optimal strategies when using winratios > 1/2.
Related:
Systemtrading
Expectancy
Senin, 22 Mei 2006
EXPECTANCY AND WIN RATIO (2)
My posting about expectancy made very clear the importance of this quantity for developing and valuating tradesystems. A good and clear understanding of the meaning of Expectancy is therefore necessary. But how important expectancy may be, one of my last statements is that, at least for me, the winratio is of very great use. I want to place some additions and comments on expectancy here.
We know that:
Van Thorp uses in his analyses the expectancy per dollar risk, the expected return of a trade per dollar invested. He therefore divides E by the average loss L. Three examples may clear up the influences of the varying parameters involved.
I. Suppose an average win of 200 euro, an average loss of 100 euro, a win ratio of 0.75.
E becomes 0.75*200- 0.25*100 = 125 euro. Per euro risk is this 125/00 = 1.25
II. Now suppose the average loss two times as big, eg. 200 euro.
E = 0.75*200 - 0.25* 200 = 100, per euro risk of 1 euro.
III. Now we halve in our first example the average win to 100 euro.
E = 0.75*100 - 0.25* 100 = 50 euro, per euro risk 0.5 euro.
IV. Let p be increased with a factor of 15% eg p= 0.8625 in our first example.
E = 0.8625*200 - 0.1375*100 = 158.75 euro which is almost a double of increase for E.
With these examples we see that increasing the average win is more favourable for the expectancy and therefore the profability than decreasing the average loss, but also that increasing the win ratio proportional increasing the expectancy.
We can write Expectancy per euro risk as:
(2) Describes the expectancy per euro risk as a lineair function of R, so a line with slope p. When putting E = 0 (2) becomes:
0= pR - q , so R = q/p the intersection with the horizontal R axis and -q the intersection with the vertical E axis. See the figure below
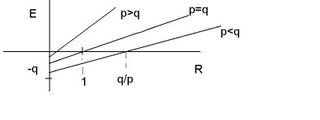
From this figure we can see that if p < q eg. p < 1/2, R the profit ratio has to be bigger than 1 and even bigger than q/p for the expectancy to become positive. When p > 1/2, R also equals q/p but because in this case the ratio q/p is less than 1, a positive expectancy can be expected sooner, eg. with a smaller profit loss ratio.
The figure also gives how big q/p has to be for a system with a positive expectancy for a given profit loss ratio R.
Another point which has to be made with relation to expectancy is that formula (1) for the expectancy is only an approximation for a real trading system. In a real live real tradingsystem we may expect many possible outcomes for a trade, positively or negatively, and each outcome with a different probability p. Let outcome X¡ with ¡= 1, 2 , 3 ..k and probability p¡.
The expectancy of this real live tradingsytem becomes more complicated and becomes:
ΣP¡X¡ /ΣP¡(X¡)^2
See for a formalism this article about Money management.
Another point to be made here is that returns, the outcomes of a system may not be normally distributed but oblique towards (hopefully!) positive returns. This may especially being the case when using a fixed stop. Such a distribution may be more precisely described as a Weibull distribution, an interesting point but beyond the scope of this posting.
I currently look at my returns with respect to a Weibull distribution. One of the nice things of this kind of representation is that a Weibull distribution has a surprisingly relatively simple calculus involved.
Systemtrading
Expectancy
We know that:
- E = P(w)W - P(l)L (1)
- where:
- E = expectancy
- P(w)= probability of a loss
- P(l)= probability of a win
- W = average win
- L = average loss.
Van Thorp uses in his analyses the expectancy per dollar risk, the expected return of a trade per dollar invested. He therefore divides E by the average loss L. Three examples may clear up the influences of the varying parameters involved.
I. Suppose an average win of 200 euro, an average loss of 100 euro, a win ratio of 0.75.
E becomes 0.75*200- 0.25*100 = 125 euro. Per euro risk is this 125/00 = 1.25
II. Now suppose the average loss two times as big, eg. 200 euro.
E = 0.75*200 - 0.25* 200 = 100, per euro risk of 1 euro.
III. Now we halve in our first example the average win to 100 euro.
E = 0.75*100 - 0.25* 100 = 50 euro, per euro risk 0.5 euro.
IV. Let p be increased with a factor of 15% eg p= 0.8625 in our first example.
E = 0.8625*200 - 0.1375*100 = 158.75 euro which is almost a double of increase for E.
With these examples we see that increasing the average win is more favourable for the expectancy and therefore the profability than decreasing the average loss, but also that increasing the win ratio proportional increasing the expectancy.
We can write Expectancy per euro risk as:
- E = pW -qL, off course p+q = 1
- E/L = (pW- qL)/L
- E/L = (p/L)*W -q/L*L
- E/L = pR - q (2)
- in which R= W/L the profit factor.
(2) Describes the expectancy per euro risk as a lineair function of R, so a line with slope p. When putting E = 0 (2) becomes:
0= pR - q , so R = q/p the intersection with the horizontal R axis and -q the intersection with the vertical E axis. See the figure below

From this figure we can see that if p < q eg. p < 1/2, R the profit ratio has to be bigger than 1 and even bigger than q/p for the expectancy to become positive. When p > 1/2, R also equals q/p but because in this case the ratio q/p is less than 1, a positive expectancy can be expected sooner, eg. with a smaller profit loss ratio.
The figure also gives how big q/p has to be for a system with a positive expectancy for a given profit loss ratio R.
Another point which has to be made with relation to expectancy is that formula (1) for the expectancy is only an approximation for a real trading system. In a real live real tradingsystem we may expect many possible outcomes for a trade, positively or negatively, and each outcome with a different probability p. Let outcome X¡ with ¡= 1, 2 , 3 ..k and probability p¡.
The expectancy of this real live tradingsytem becomes more complicated and becomes:
ΣP¡X¡ /ΣP¡(X¡)^2
See for a formalism this article about Money management.
Another point to be made here is that returns, the outcomes of a system may not be normally distributed but oblique towards (hopefully!) positive returns. This may especially being the case when using a fixed stop. Such a distribution may be more precisely described as a Weibull distribution, an interesting point but beyond the scope of this posting.
I currently look at my returns with respect to a Weibull distribution. One of the nice things of this kind of representation is that a Weibull distribution has a surprisingly relatively simple calculus involved.
Systemtrading
Expectancy
Kamis, 18 Mei 2006
A REVEARSAL CHART PATTERN
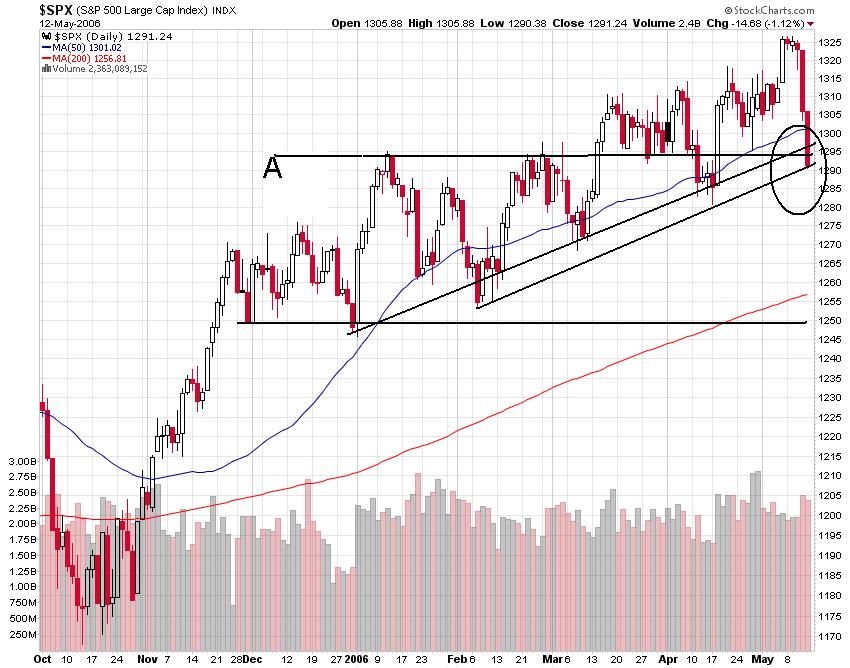
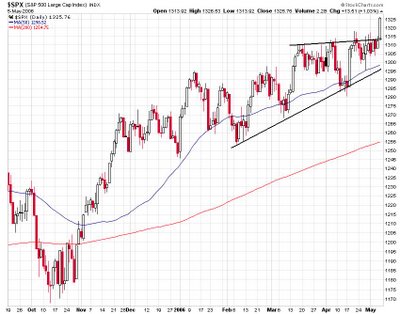
Markets clearly topping off the last days,as expecting in my post 'The end of Trends' , almost totally correct the rise of this year. You can see this in the chart of the S&P500 , the Dow Jones and the German FDAX.
Chart patterns can be very usefull, but are not easily recognised immediatelly. It is allways easy to see a top revearsal afterwards as shown in a post of Stepan Vita. He describes a classical top pattern in the chart of Toll Brothers (TOL). You can see a Shoulder, Head Shoulder (HSH) pattern and also a black cross. Now this is recognised at the moment when most of the correction of last years bullish trend has been done, but off course difficult to predict in an earlier stage, eg after the HSH patten occured.
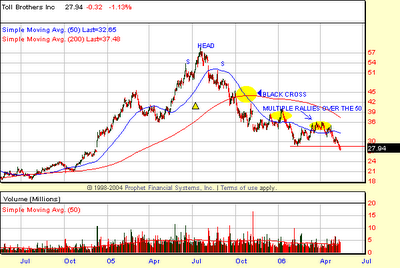
Chart patterns can be very usefull, but are not easily recognised immediatelly. It is allways easy to see a top revearsal afterwards as shown in a post of Stepan Vita. He describes a classical top pattern in the chart of Toll Brothers (TOL). You can see a Shoulder, Head Shoulder (HSH) pattern and also a black cross. Now this is recognised at the moment when most of the correction of last years bullish trend has been done, but off course difficult to predict in an earlier stage, eg after the HSH patten occured.

Rabu, 17 Mei 2006
Reducing Your Unsecured Debt
A recent survey showed that more than 2 million people in the
UK had unsecured debt of more than £10,000 (approximately
$16,000). As you can imagine most of this debt is held on Store
and Credit Cards, which are quite often the most expensive form
of unsecured debt an individual can acquire.
How manageable this debt is, is often down to the individual's
circumstances. One thing for sure is that when borrowing you
want to aim to reduce the amount of interest that you pay on
any outstanding debt. Here are a few tips to achieve this.
1. Pay off expensive debt first
Unsecured lending is by far the most expensive borrowing and if
you have a number of cards, some probably charge higher interest
rates than others. If you are not paying off the full balance of
your credit card each month, aim to pay more off the most
expensive cards.
2. Transfer expensive debt to cheaper cards
There's a lot of competition out there. Many credit cards have
introductory offers with either low or zero interest rates.
Transfer your balances from your old card to these new cards.
Remember to close your old credit card accounts to remove
temptation. It is a well known fact that many people don't
close their old accounts and then rack up more debt on both the
old and new accounts.
3. When you've cleared some debt, try not to borrow more
When you've cleared your credit card balances, try to get into
the habit of only spending what you earn. Stop using the cards
and to remove temptation cut them up. It pays to disciplined.
Remember you're trying to reduce debt. The best thing to do is
to create a budget for yourself and pay for everything with
cash.
Obviously this isn't an exhaustive list, but if you follow
these tips it will be a positive move in the right direction.
About The Author: Ian Walsh is the webmaster at
http://www.samuelblanksonbooks.info, information on Finance,
Gambling and Self-Help.
Credit Card Debt Statistics
In the United States, the debt levels of Americans have
continued to increase since the 1980s. It was during this time
that the use of credit cards greatly increased. Credit cards
companies begin looking for different ways to market their
products to consumers, and used such things as direct mail,
commercials, and other marketing tactics.
It was during the 1980s that consumers begin moving away from
cash and checks into credit cards. The cause of this is often
attributed to the start of the information age. As the use of
computers became more widespread, credit cards quickly
followed. It is estimated that the number of people using
credit cards during this time surpassed those who were using
checks and cash in a single year. The use of debit cards has
grown tremendously since this time as well.
The rise of debit cards are a direct result of the problems
seen with using credit cards. Statistics show that the average
American consumer owes about $9,000 in credit card debt. Many
people have made the mistake of thinking that they are using
their own money when they use credit cards to make purchases.
It is easy to forget that this money is owned by the credit
card companies, and they are simply allowing you to borrow it,
with the promise you will pay it back. The average interest
rate owed on credit cards in the US is about 14%.
It is easy to view credit cards as being "easy money." After
all, you don't have to work for it, and it doesn't have the
same effect on you that cash has. Statistics show that people
have a tendency to spend the money of others much faster than
their own. Recent data also shows that Americans are paying
even less of their debts than ever before. It was recently on
the news that the savings rate for Americans is negative, at
about -0.05%.
Though we live in an electronic age, being irresponsible with
your credit cards is a great way to end up with a life time of
headaches. Many high quality jobs now require you to have good
credit, and it is difficult to get a mortgage or a car if you
have poor credit. This is why it pays to be responsible with
how you manage your finances. It is best to stop borrowing
money and use your own funds to make purchases.
About The Author: Joe Kenny writes for the credit card
comparison sites http://www.creditcards121.com and also
http://www.cardguide.co.uk
Please use the HTML version of this article at:
http://www.isnare.com/html.php?aid=49169
Selasa, 16 Mei 2006
RANDOM WALK, GAMBLING AND TRADING
Physical problems are sometimes modelled as random walks, sometimes also called a "drunkard's walk". In this model many successive steps are taken, but each in a random direction. The direction of each step being independant of the direction of the previous one.
A famous example is the Brownian motion of a smoke particle in very dilute gas. The invisible gasmolecules colliding at random against the, in comparison to the molecules, very big smoke particle. In two dimensions a random walk can be seen in the figure below.
Random walk of 1000 steps
Random walks have serious implications for probabilty events. When throwing a fair coin, you know the chance of a head equals the chance of a tail (50:50 or p= 1/2). But what are possible outcomes when throwing a fair coin? Suppose the coin did come with a streak of 6 tails in a row? What is the chance of the next throw also being a tail? The chance of another tail is just 1/2 independant of the foregoing outcome.
Many people intuitively assume that after a series of consequtive tails a head must show up with greater certainty. There are many examples of this assumption of what is called the expectation a regression to the mean.
Last night I watched on television a pokergame (Texas Hold'em at the Poker Den organised by PartyPoker.com). There was this beautifull young lady getting bad cards al night and the commentators just outbursted that it is not possible to get bad cards forever, she had to get good cards at last: she played out without getting a picture and only a few hands played.
The man in the casino watching slot machines which didnot pay out for a long time is also an example of an expection for a regression to the mean. Casino's know this too well and just let the slot machines produce random numbers so the next outcome is independant of the previous one: a losing game by all means, the edge is to the house, the chance of a win is smaller than 1/2.
But let's return to a coin. I found an astonishing picture in A Guide To Gambling, Love, The Stock Market & And About Everything Else, a book I noted before.
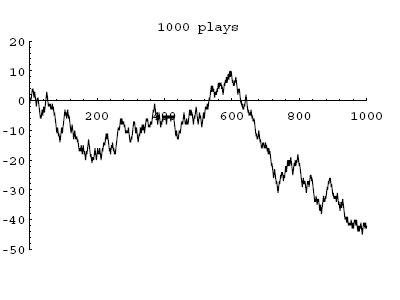
The graph shows the result of a computer-simulated sequence of thousend thosses of a fair coin, eacch time a head is coming up it adds up +1 and when a tail comes up-1. You feel since the probability of each result, tail or head, is equal, here should be as may heads as tails after a certain time.
Now this is true but only after a very long time, in fact after infinite time. Over the short term, which may relatively long periods, more heads than tails occur and vice versa. This supposes very long lasted unexpected streaks of either tails or heads. This is the random walk of a coin.
There is a formula for the probability of a streak:
For an explanation and an example see winning and losing streaks.
We return to our activities on the stockmarket. Market prices are sometimes also considered as random walks (especially as the outcome a of classical price theories). In a way we could see in graph above the movement of a stock price (or future or whatever) in time.
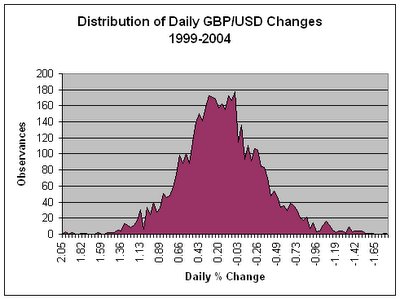
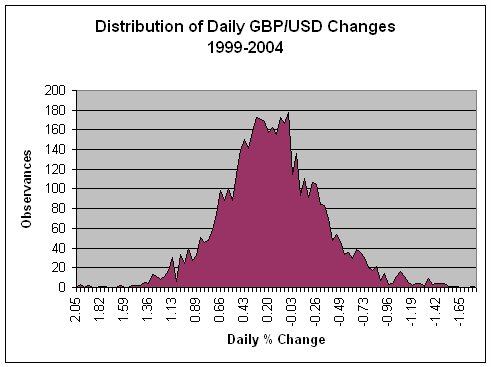
In an earlier posting I gave a distribution of one day and 5 days returns on the GBP/USD. Clearly these distributions are not random: it resembles more of a normal distribution around a mean. Whatever it is, the movements in a much smaller timeframe, eg ticks, could still be a random walk. Maybe the duration in which the one day and 5 day returns are gathered is just to small to reject a random walk.
In approximation the distance R² from a starting point in a random walk to the end point is proportional to N in which N is total of steps:
R² = N*r
(2)
r is the square root of the average squared step size or root mean squared step size. If I take r as a tick on the FDAX and normalise to 1 formula (2)becomes:
R² = N.
and R is epresssed in ticks.
(followed)
Systemtrading
gambling and trading
A famous example is the Brownian motion of a smoke particle in very dilute gas. The invisible gasmolecules colliding at random against the, in comparison to the molecules, very big smoke particle. In two dimensions a random walk can be seen in the figure below.

Random walk of 1000 steps
Random walks have serious implications for probabilty events. When throwing a fair coin, you know the chance of a head equals the chance of a tail (50:50 or p= 1/2). But what are possible outcomes when throwing a fair coin? Suppose the coin did come with a streak of 6 tails in a row? What is the chance of the next throw also being a tail? The chance of another tail is just 1/2 independant of the foregoing outcome.
Many people intuitively assume that after a series of consequtive tails a head must show up with greater certainty. There are many examples of this assumption of what is called the expectation a regression to the mean.
Last night I watched on television a pokergame (Texas Hold'em at the Poker Den organised by PartyPoker.com). There was this beautifull young lady getting bad cards al night and the commentators just outbursted that it is not possible to get bad cards forever, she had to get good cards at last: she played out without getting a picture and only a few hands played.
The man in the casino watching slot machines which didnot pay out for a long time is also an example of an expection for a regression to the mean. Casino's know this too well and just let the slot machines produce random numbers so the next outcome is independant of the previous one: a losing game by all means, the edge is to the house, the chance of a win is smaller than 1/2.
But let's return to a coin. I found an astonishing picture in A Guide To Gambling, Love, The Stock Market & And About Everything Else, a book I noted before.

The graph shows the result of a computer-simulated sequence of thousend thosses of a fair coin, eacch time a head is coming up it adds up +1 and when a tail comes up-1. You feel since the probability of each result, tail or head, is equal, here should be as may heads as tails after a certain time.
Now this is true but only after a very long time, in fact after infinite time. Over the short term, which may relatively long periods, more heads than tails occur and vice versa. This supposes very long lasted unexpected streaks of either tails or heads. This is the random walk of a coin.
There is a formula for the probability of a streak:
- q = [1+(n-r) p]q' (1)
- n = amount of tosses (trades!)
- r = losing streak
- p = chance of a single outcome
- q' = P^r (power r)
For an explanation and an example see winning and losing streaks.
We return to our activities on the stockmarket. Market prices are sometimes also considered as random walks (especially as the outcome a of classical price theories). In a way we could see in graph above the movement of a stock price (or future or whatever) in time.
In an earlier posting I gave a distribution of one day and 5 days returns on the GBP/USD. Clearly these distributions are not random: it resembles more of a normal distribution around a mean. Whatever it is, the movements in a much smaller timeframe, eg ticks, could still be a random walk. Maybe the duration in which the one day and 5 day returns are gathered is just to small to reject a random walk.
In approximation the distance R² from a starting point in a random walk to the end point is proportional to N in which N is total of steps:
R² = N*r
(2)
r is the square root of the average squared step size or root mean squared step size. If I take r as a tick on the FDAX and normalise to 1 formula (2)becomes:
R² = N.
and R is epresssed in ticks.
(followed)
Systemtrading
gambling and trading
Minggu, 14 Mei 2006
THE END OF TRENDS?
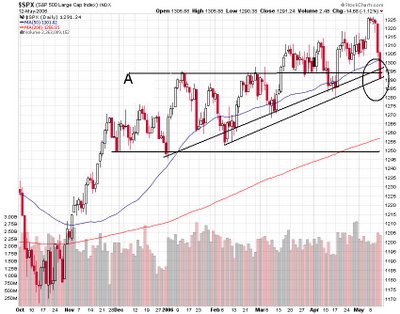
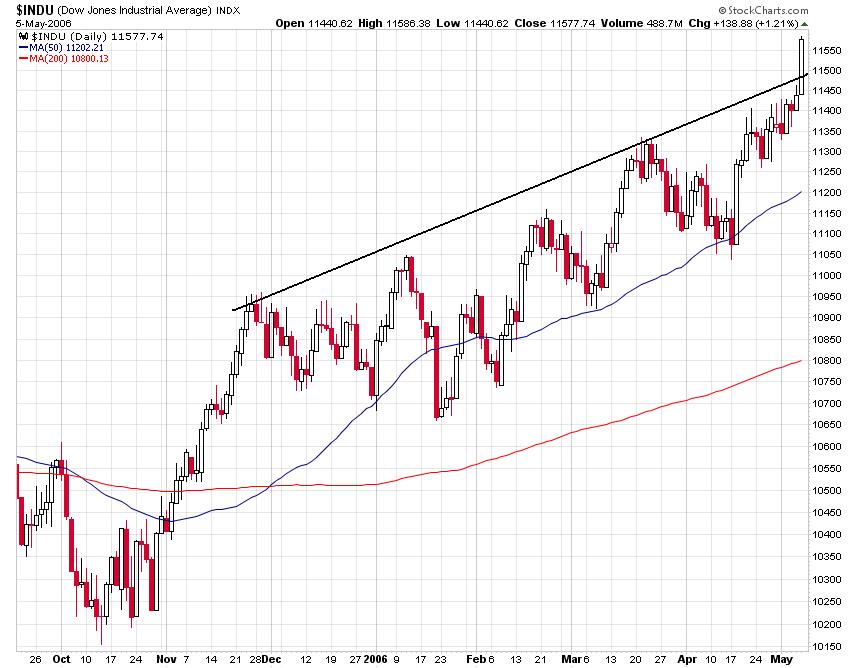
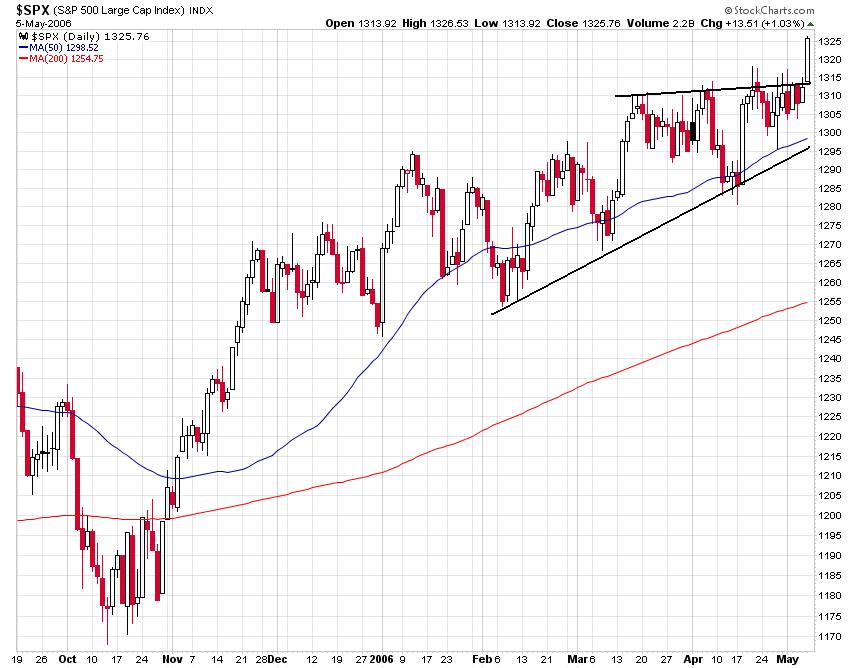
Trends do end in any given timeframe. We saw on the last two days what maybe an end of this years strong bull trend, although it may not be over yet.
I was thinking of this when reading Paolo Pezzutti's posting what Mr. Buffet warnes about speculation and and the investments of the public. I cite his posting:
"The price of metals, such as copper, and other commodities like oil, initially climbed on fundamentals, but the gains have now attracted more investors betting on further price gains, he explained. “What the wise man does at the beginning the fool does at the end,” he quipped. “Once a price history develops enough for other people to see it and get envious, that takes over markets. We’re seeing that some areas of the commodity markets.” "
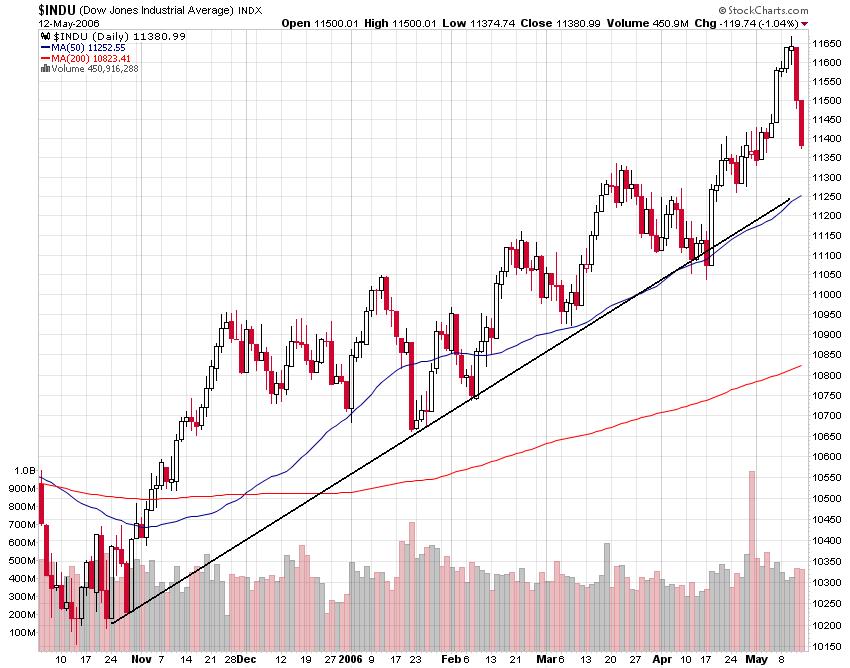
"Selling in may and go away" be the right thing to now. The DOW still in it's trend but the broader markets aren't. See charts below, click for a full screen.

Systemtrading
Dow Jones
trends
I was thinking of this when reading Paolo Pezzutti's posting what Mr. Buffet warnes about speculation and and the investments of the public. I cite his posting:
"The price of metals, such as copper, and other commodities like oil, initially climbed on fundamentals, but the gains have now attracted more investors betting on further price gains, he explained. “What the wise man does at the beginning the fool does at the end,” he quipped. “Once a price history develops enough for other people to see it and get envious, that takes over markets. We’re seeing that some areas of the commodity markets.” "
"Selling in may and go away" be the right thing to now. The DOW still in it's trend but the broader markets aren't. See charts below, click for a full screen.

Systemtrading
Dow Jones
trends
Kamis, 11 Mei 2006
TRADES AND MARKET MOVEMENTS
After a couple of days I was finally able today to place some orders on the FDAX and on the DOW future.
What was the reason for not trading? Well, the market did not came up with my favourable setups but just trended upwards very strongly, every position would be unsecure. We have to see if the market wil revearse from here for a more longer time or just a blow off after FED's decision and suggestions about further interest rates.
Joao and fernando of Hello Dax, a blog on which I am invited to write something about futures, propose a setup for a winning option strategy on the DAX. I have some doubts about this.
Movements on markets are not linear as they suppose to assume but rather random walks, certainly in the short and middle long time span. Markets move in a jagged fashion which may be demonstrated by comparing distributions of returns over various time periods. Just look at the graphs below.
The fact that the range of the 5-day distribution is nowhere near five times the width of the 1-day distribution (in terms of max to min) tells you the market
almost never moves directly from point A to point B. Off course this is a valuta index but you may expect this being the case for stock indices too. Options are very susceptiable for such movements.

Dow Jones
FDAX
Systemtrading
Rabu, 10 Mei 2006
BEARS: ALLWAYS UP ?
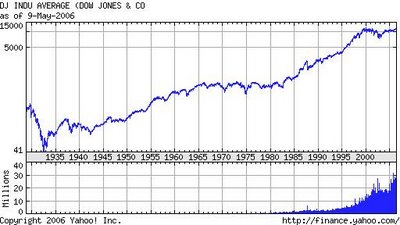
Fridays outbreak at the markets must be something of a killer for the bears as Stephan Vita notes on his blog. They may think they are right and the markets wrong..The Dow Jones tries to hit all time high, attracted by it like a magnet.
See chart of the Dow since 1935. Allways good to see and now you know why our queen became so rich.
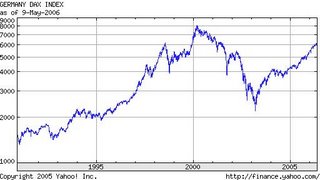
The European indices still some 25 to 30 % away from the highs of 2000, so they have a long way to go. See chart of the Dax since 1990.
Dow Jones
FDAX
See chart of the Dow since 1935. Allways good to see and now you know why our queen became so rich.

The European indices still some 25 to 30 % away from the highs of 2000, so they have a long way to go. See chart of the Dax since 1990.

Dow Jones
FDAX
Senin, 08 Mei 2006
MARKETS UPDATE
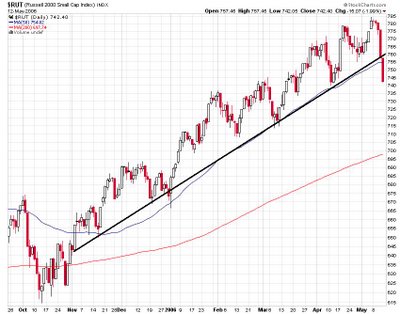
Both the S&P 500 and the Dow Jones closing to year highs eploring new territories as you can see in the charts. The broader Russel 2000 (symbol: $RUT) at all time high. We cannot go up forever, what are the underlying reasons for these uptrends? I don't know and it doesnot bother me either. I do know we will correct someday, but not now.
Dow Jones
Dow Jones
Kamis, 04 Mei 2006
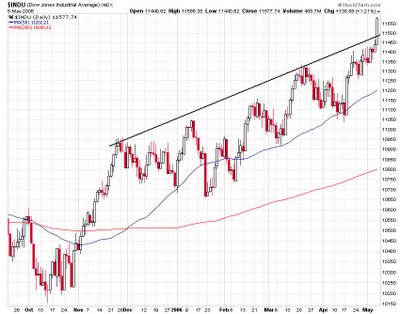
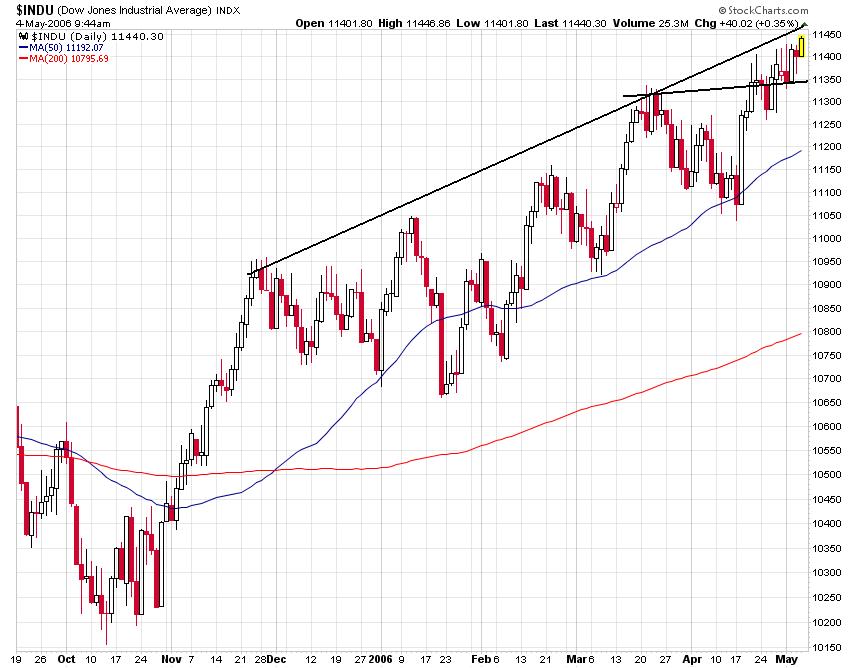
DOW JONES UPDATE
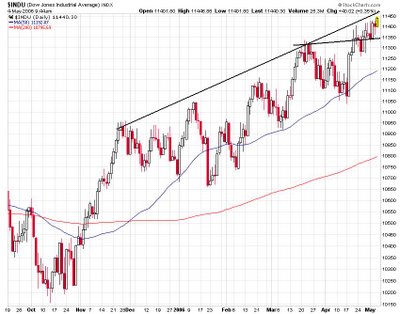
The last days the Dow Jones wrestling with the 11400 level. Let us see if it can stay above this level maybe testing the upper trend line today. See chart.
Dow Jones
Dow Jones
DISCIPLINE AND MISSING THE BIG ONE
Discipline has many faces when it becomes to trading. Earlier I gave the doubts and visions of globetrader. Now the word is to Victor Niederhoffer himself taken from his website. Later on I will give my experiences. He describes the subject of stubborness of traders, a must be killer to a trader. Never ever be stubborn in your vision when markets are against you. It is good to have a vision in general but never fight against the market, because you wil lose. Remember markets and trading is not of being right but of making money.
Comparing the battle between some passengers taking his bus with the operator due to possible delay and gamblers completely losing their senses in attempt not to miss even one chance.:
"....and that the remaining passengers, who were involved in a screaming battle with the bus operator over possible delay in getting to the track on time were more typical. This remnant certainly suffered from the tendency of all gamblers to completely lose their sense of balance and priorities in a desperate attempt not to miss even one chance to get even"
Traders inevitably allways see comparisons with their trading activities but this one surely being a surprising one and funny too.
He goes on:
"I once had a client from the Mediterranean who insisted on selling the stock market futures short whenever it set a five-day low. He lost about 20 times in a row after 1987 and I advised him to take a break. "I can't. The big crash might come while I was away." he said."
And than off course romance comes into play:
"remember Artie's telling me that one of his best friends missed his wedding and never married because he got into a card game on a train going to his own wedding"
I admire Niederhoffers style and the surprising turns his articles take, sometimes long-winded but allways pointing to trading and the markets.
So stubbornness and losing sense of balance leading a trader to disaster.
There is another aspect which is as deadly as those mentioned: addiction to trading. In a comment (Jared Albert) puts his experiences:
"..the anxiety of watching the market rebound and being unable to trade was unbearable and eventually he'd have to take the phones to work with him after a losing streak. Luckily I wiped out 3 times in 6 years and discovered that the pain of having no steak is worse than the pain of missed opportunities."
"The issue of compulsive trading or trading for excitement are clearly among the most dangerous."
Now misssing the big one or addiction to trading being totally different from problems whith missing some good opportunities that can arise by various reasons as abstinence or pulling the trigger fear. I wrote earlier about missing trades.
Systemtrading
Senin, 01 Mei 2006
DISCIPLINE WITH TRADING
Yesterday Globetrader added an interesting posting about discipline in trading. He compares it with stopping with chocolate. He used yesterdays holiday to investigate this aspect on his trading and studied the patterns when losing his discipline.
Some quotations made by him:
"You have an edge, you have your good winning streaks, but somehow the losers still take care of them and at the end of the month, at the end of the quarter you have retraced back to zero."
"Be it one or two exceptionell big losers, because everything you’ve learned the last few years goes overboard, in this moment, or be it a streak, where nothing you do seems to work, where you get signal after signal and they all get stopped out."
He admits to be in the first category:
"I’m in the first category, I blew it all in 1 or 2 exceptionell bad trades, sit there, look at me, tell me “oh shit Chris, you did it again”."
And:
"I know I can, I know I have an edge, I trust myself and I’m (usually) not trigger shy. But I have these whipsaw trades coming now and then, which take care of a good chunk of my profits."
I find this very brave to admit because I know he is true.
More about trading and discipline:
Langganan:
Postingan (Atom)
