Jumat, 02 November 2007
Senin, 12 Februari 2007
PREDICTION OF THE FUTURE IN TRADING
It is a general knowledge that the future cannot be predicted. Nobody knows exactly what will happen tomorrow let alone in a year. This fact leaves us with a very uncertain feelings and no surprise that a deep drive to try to control the environment and the future.
This can be seen in almost every field where humans operate: from production processes in factories to climate change models. Also traders face the challenge of dealing with the future.
Various methods exist to control and to get grip on the future and all of them are used by traders. Indicators, chart patterns, the use of regular cycles in one or other way (Gann), astrology and so on.
A good starting point to value these methods is to understand that future prices of assets cannot be predicted in general and the only way to deal with this is to use a concept of expectation of the future. An example with throwing a dice naturally comes in mind here.
Everyone knows that throwing a fair dice enough times will result in equally divided amount of the faces coming up. This is the same as saying the probability of a one, a two etc. is exactly 1/6. Our expectation of throwing a fair dice is 1/6 and so we know the future of this dice throwing process fairly well.
There is only one key assumption made here: a dice has to be a fair one. This is crucial. The consequence of using a fair dice is that it can be shown in a mathematical way that the expectation of throwing a fair dice is 1/6. This concept is used in our daily lives over and over again and used by traders. But here is also a big bootstrap.
Mathematics is not physics. Though the assumption of a fair dice maybe in reality a fairly good one (in fact, the contrary is assumed, if throwing a dice is not coming with our expectation of it, we assume the dice to be not fair). We are never sure if a dice is a perfect dice in a way that no imperfections exist with its faces which would result in unexpected results. Even when we know that such small imperfections exist we also know that it may not lead to in a different outcome when throwing it.
The understanding of this has consequences for our daily lives and the understanding of our evolution as human and so philosophical implications too.
Two examples from Traders of February may clarify my thoughts about this. The first one is about a so called Delta phenomenon from Marko Graenitz and the second from Tomasini and Jaecle about the use of indicators.
The Delta phenomenon is proposed to predict the future moves of commodities. The author shows how this delta is performing when used for the FDAX and the FTSE. It shows a fairly good forecast at the end of 2005 to 31 December 2006 for both of them compared with the actual chart. Without going into the question how good these predictions are (goodness of fit), two remarks have to be made here.
The apparent good prediction for these two index futures does not necessarily mean much if you realize that these are made over the same period of time because many if not all index futures showed the same strong upward movement the last year and the Delta would produce the same result for all of these indices used over the same time span.
The second critical remark is the following: whenever a prediction is made about the future that afterwards proved to be accurate what does this say about other predictions over other timeframes in other circumstances? When something seems to work here, does it still work there and there and then?
Think about the predictions of soccer games on Saturday or Sunday: there will be once in while someone who predicts all twelve games correctly, as there will always be somebody who predicted in the past the current oil price and so on. In the same line, always something can be found that predicts at a certain time fairly good a price in the future.
Another example is proposed by Tomasini and Jaekle. They propose a system based on a short period indicator and a filter of a longer period to obtain trade entries. The result is a very promising equity curve based on serious performed back tests over more than 600 trade entries during 3 years.
The question is off course, does the system produce the same results in the future.
This question is basically this: are results from a certain period in the past significant for a bigger period, a period also including the future in terms of expectation? In a way this can be stated as follows: is finding a good back testing result the same as finding a fair dice?
What I missed in these tests is at least a so called out of date test (sometimes referred as a forward test), a simulation of the system in real time. It will not be the first a time a good back testing does not result in good forward testing which is sometimes partly due to wrong interpretations of the back testing or partly to other factors. Also and very important the period which was tested may just not to be significant for the overall performances o the system.
This can be seen in almost every field where humans operate: from production processes in factories to climate change models. Also traders face the challenge of dealing with the future.
Various methods exist to control and to get grip on the future and all of them are used by traders. Indicators, chart patterns, the use of regular cycles in one or other way (Gann), astrology and so on.
A good starting point to value these methods is to understand that future prices of assets cannot be predicted in general and the only way to deal with this is to use a concept of expectation of the future. An example with throwing a dice naturally comes in mind here.
Everyone knows that throwing a fair dice enough times will result in equally divided amount of the faces coming up. This is the same as saying the probability of a one, a two etc. is exactly 1/6. Our expectation of throwing a fair dice is 1/6 and so we know the future of this dice throwing process fairly well.
There is only one key assumption made here: a dice has to be a fair one. This is crucial. The consequence of using a fair dice is that it can be shown in a mathematical way that the expectation of throwing a fair dice is 1/6. This concept is used in our daily lives over and over again and used by traders. But here is also a big bootstrap.
Mathematics is not physics. Though the assumption of a fair dice maybe in reality a fairly good one (in fact, the contrary is assumed, if throwing a dice is not coming with our expectation of it, we assume the dice to be not fair). We are never sure if a dice is a perfect dice in a way that no imperfections exist with its faces which would result in unexpected results. Even when we know that such small imperfections exist we also know that it may not lead to in a different outcome when throwing it.
The understanding of this has consequences for our daily lives and the understanding of our evolution as human and so philosophical implications too.
Two examples from Traders of February may clarify my thoughts about this. The first one is about a so called Delta phenomenon from Marko Graenitz and the second from Tomasini and Jaecle about the use of indicators.
The Delta phenomenon is proposed to predict the future moves of commodities. The author shows how this delta is performing when used for the FDAX and the FTSE. It shows a fairly good forecast at the end of 2005 to 31 December 2006 for both of them compared with the actual chart. Without going into the question how good these predictions are (goodness of fit), two remarks have to be made here.
The apparent good prediction for these two index futures does not necessarily mean much if you realize that these are made over the same period of time because many if not all index futures showed the same strong upward movement the last year and the Delta would produce the same result for all of these indices used over the same time span.
The second critical remark is the following: whenever a prediction is made about the future that afterwards proved to be accurate what does this say about other predictions over other timeframes in other circumstances? When something seems to work here, does it still work there and there and then?
Think about the predictions of soccer games on Saturday or Sunday: there will be once in while someone who predicts all twelve games correctly, as there will always be somebody who predicted in the past the current oil price and so on. In the same line, always something can be found that predicts at a certain time fairly good a price in the future.
Another example is proposed by Tomasini and Jaekle. They propose a system based on a short period indicator and a filter of a longer period to obtain trade entries. The result is a very promising equity curve based on serious performed back tests over more than 600 trade entries during 3 years.
The question is off course, does the system produce the same results in the future.
This question is basically this: are results from a certain period in the past significant for a bigger period, a period also including the future in terms of expectation? In a way this can be stated as follows: is finding a good back testing result the same as finding a fair dice?
What I missed in these tests is at least a so called out of date test (sometimes referred as a forward test), a simulation of the system in real time. It will not be the first a time a good back testing does not result in good forward testing which is sometimes partly due to wrong interpretations of the back testing or partly to other factors. Also and very important the period which was tested may just not to be significant for the overall performances o the system.
Senin, 15 Januari 2007
CONSEQUTIVE LOSSES
In two lucid and interesting articles in Traders of January two subjects were discussed, subjects I studied extensively. Luca Barberis tried to give an answer to the question how trading of various markets can enhance the equity curve without optimising individual trading systems. Optimising hides the danger of curve fitting. Though his results are very important a few aspects remains to be answered before applying his method: how many contracts do you trade the various markets, which is not a matter of classical position sizing matters and the question of a possible trade system correlation and what effect this has on risk.
Risk is the main subject of Philip Kahler in Traders. He treats various possible types of risk in trading, especially risk due to consecutive losses and emphasizes its importance to understand how consecutive losses can influence trading results. When studying consecutive losses in series of trades a huge field opens up: many different theoretical frameworks can be set up to master this phenomenon of trading.
There is a clear relation between the win ratio of a trade system and the length of consecutive losses. In an earlier post I stressed the importance of the win ratio in a different context. But it also plays an important role in the existence, the length, and the amount of consecutive losses.
In general can be said that the higher the win ratio the higher the chance becomes for a series of losses of a certain length. In his article Kahler gives some examples and a graphic which can be used to determine 5 or 10 consecutive losses for a given win ratio. It has to be said that these probabilities occur for a given amount of trades performed and will change negatively when the total trades increases.
Though interesting to know the chance for a series of losses it would be even more interesting to know a distribution of series of losses, e.g. the probability for all possible series of losses and moreover the maximum length of consecutive losses (maximum streak) you might expect for a given win ratio.
Below you can see a figure which gives the relation for the maximum streak and the probability of a loss (loss ratio). Total trades is 500, confidence is 0.998%.
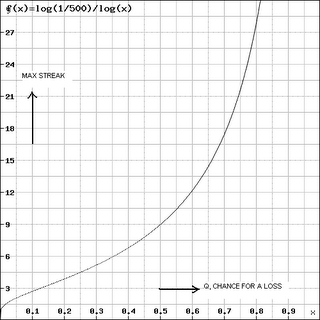
From this figure again can be seen the importance of the loss ratio: the higher this becomes (the more losses)then the maximum strak increases exponentially. E.g when q, the probability of a loss is 35% then the maximum expected streak willl be 6 but when increasing to 70% the maximum streak increases to 17 consequtive losses in a row!
Risk is the main subject of Philip Kahler in Traders. He treats various possible types of risk in trading, especially risk due to consecutive losses and emphasizes its importance to understand how consecutive losses can influence trading results. When studying consecutive losses in series of trades a huge field opens up: many different theoretical frameworks can be set up to master this phenomenon of trading.
There is a clear relation between the win ratio of a trade system and the length of consecutive losses. In an earlier post I stressed the importance of the win ratio in a different context. But it also plays an important role in the existence, the length, and the amount of consecutive losses.
In general can be said that the higher the win ratio the higher the chance becomes for a series of losses of a certain length. In his article Kahler gives some examples and a graphic which can be used to determine 5 or 10 consecutive losses for a given win ratio. It has to be said that these probabilities occur for a given amount of trades performed and will change negatively when the total trades increases.
Though interesting to know the chance for a series of losses it would be even more interesting to know a distribution of series of losses, e.g. the probability for all possible series of losses and moreover the maximum length of consecutive losses (maximum streak) you might expect for a given win ratio.
Below you can see a figure which gives the relation for the maximum streak and the probability of a loss (loss ratio). Total trades is 500, confidence is 0.998%.

From this figure again can be seen the importance of the loss ratio: the higher this becomes (the more losses)then the maximum strak increases exponentially. E.g when q, the probability of a loss is 35% then the maximum expected streak willl be 6 but when increasing to 70% the maximum streak increases to 17 consequtive losses in a row!
Langganan:
Postingan (Atom)
