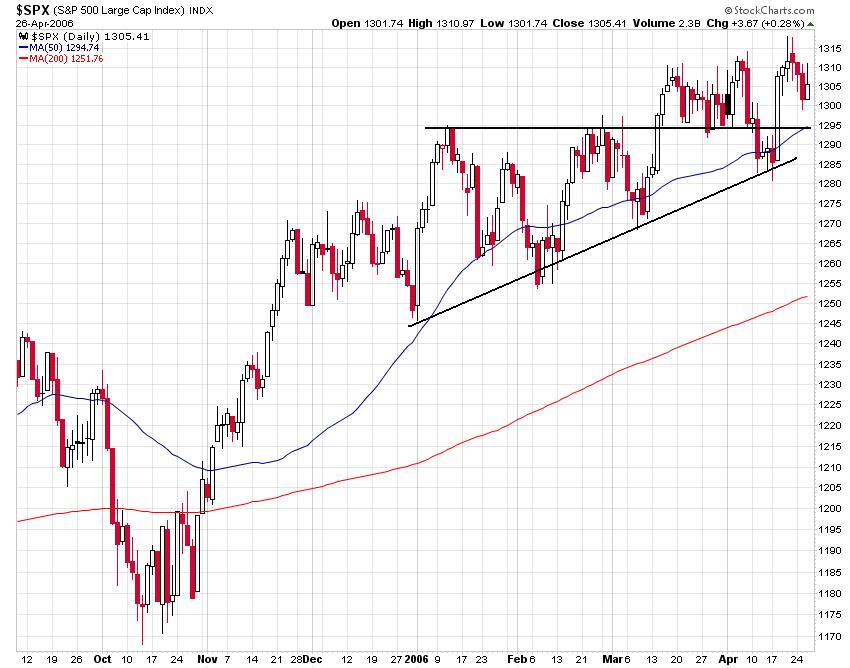
The chart of the S&P 500 is not so clear. Alhough the index being up this year, there is a broader feeling amongst traders the markets not doing very well. How does this come?
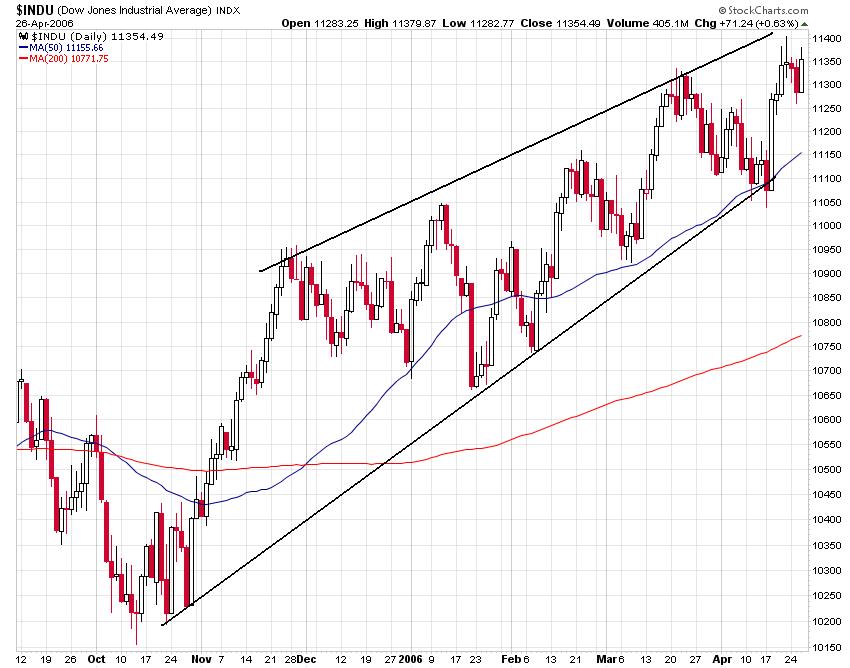
First, lt's see the charts of the Dow and the S&P, both probably taking today a breazer.
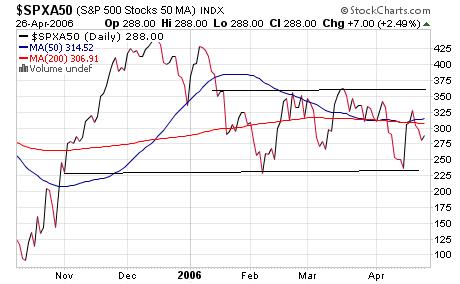
This broader sense of markets going nowhere can be understood if you look at stocks moving above or below their 50 SMA's. The ratio just moving in a range of 350 and 225 since a few monts so going sideways, on average the amount of stocks moving above their 50 SMA is not increasing and I suppose this being responsible for the general feeling by some these days.
Systemtrading
Dow Jones
trends
